

Reducing costs has always been a recurrent topic for any platform team that takes care of infrastructure.
The Adevinta team is no exception. While working on identifying cost savings opportunities, we discovered a golden low-hanging fruit that helped us reduce our bill by €5k each month. All we had to do was change a single line of code.
Impressive, right?
Now that I have your attention, grab the popcorn and follow me.
How did we identify potential savings?
Before jumping right into the solution, I want to mention our approach to identifying cost savings opportunities. I plan to share the whole process in a separate blog article, but for now, I will only say what’s important for this enhancement.
One of the key metrics we use to identify opportunities is the“over-provisioned resources” metric. Many open-source projects aim to provide this visibility for resources inside your cluster such as https://github.com/opencost/opencost
However, for us, we had already federated the Kubernetes container’s resources request/usage/limit Kubernetes metrics from the caadvisor and kub-state metrics. They give us enough information to visualise over-provisioned resources inside our Kubernetes cluster. For example, we can calculate unused resources by subtracting the pod’s requested resources from the actual runtime usage across our clusters.
With that capability, we can see several services that are underutilising the resources that they requested, and we can prioritise them based on how much waste we observe.
Low-hanging fruit
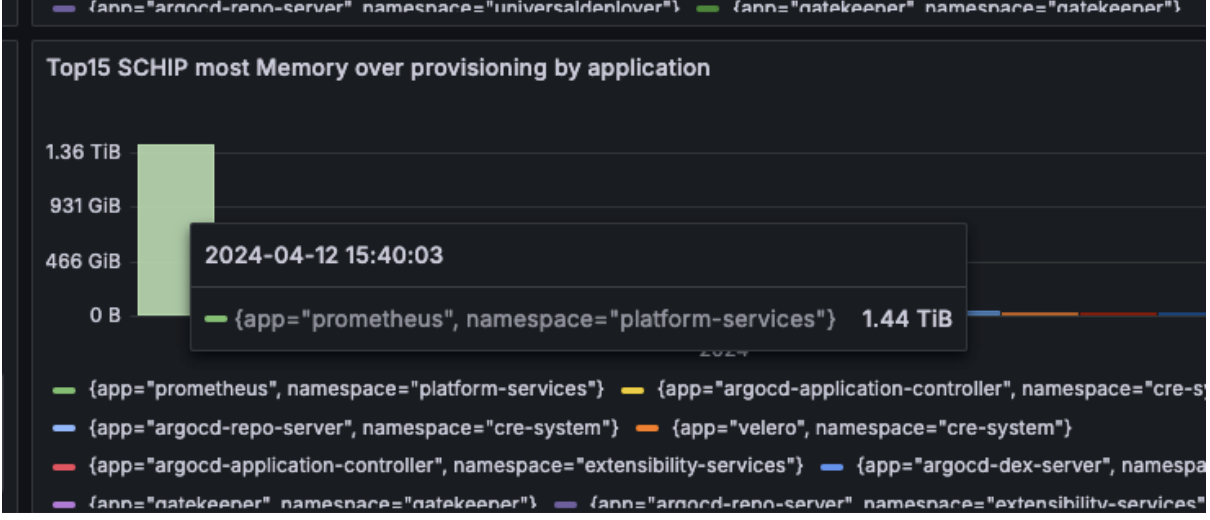
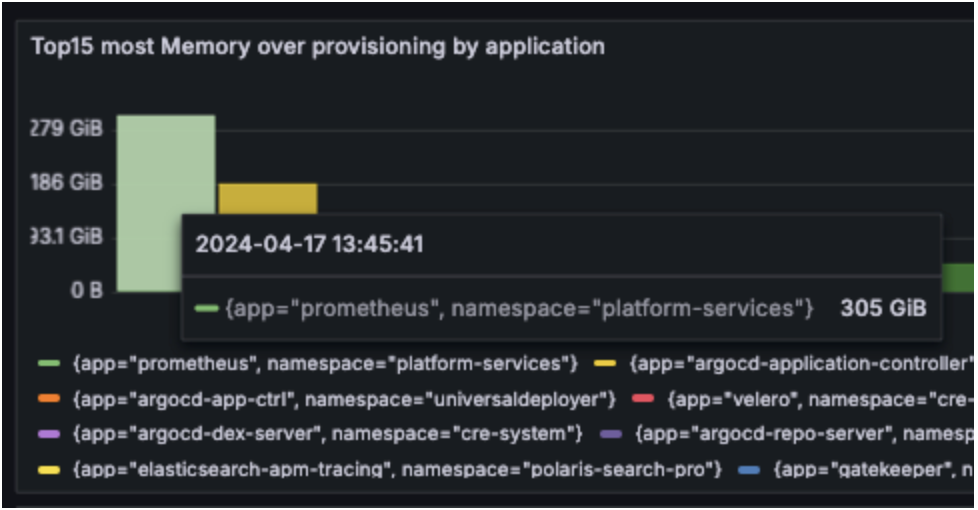
With metrics defined and applied, our resource usage dashboard highlighted the “Prometheus” application.
Prometheus is used extensively within our cluster for storing and federating both system and application metrics. We operate more than 30 Kubernetes clusters of varying sizes, so it was not surprising that Prometheus was often over-provisioned.
The challenge of setting up accurate autoscaling for such a diverse environment is significant. Our Prometheus instances range widely in their resource requirements, from the smallest clusters retaining around 16 GB of data to the largest consuming over 100 GB. To address over-provisioning, we have experimented with several strategies:
1. Sharding Instances: We partitioned our Prometheus instances based on different domains to distribute the load more evenly. This approach is effective but it increases internal complexity significantly.
2. Reducing Retention Periods: By shortening the data retention periods, we aimed to decrease overall storage needs.
Despite these efforts, achieving a balanced autoscaling configuration remains complex. We implemented the Vertical Pod Autoscaler (VPA) to assist with autoscaling, but the dynamic nature of our workloads posed additional challenges.
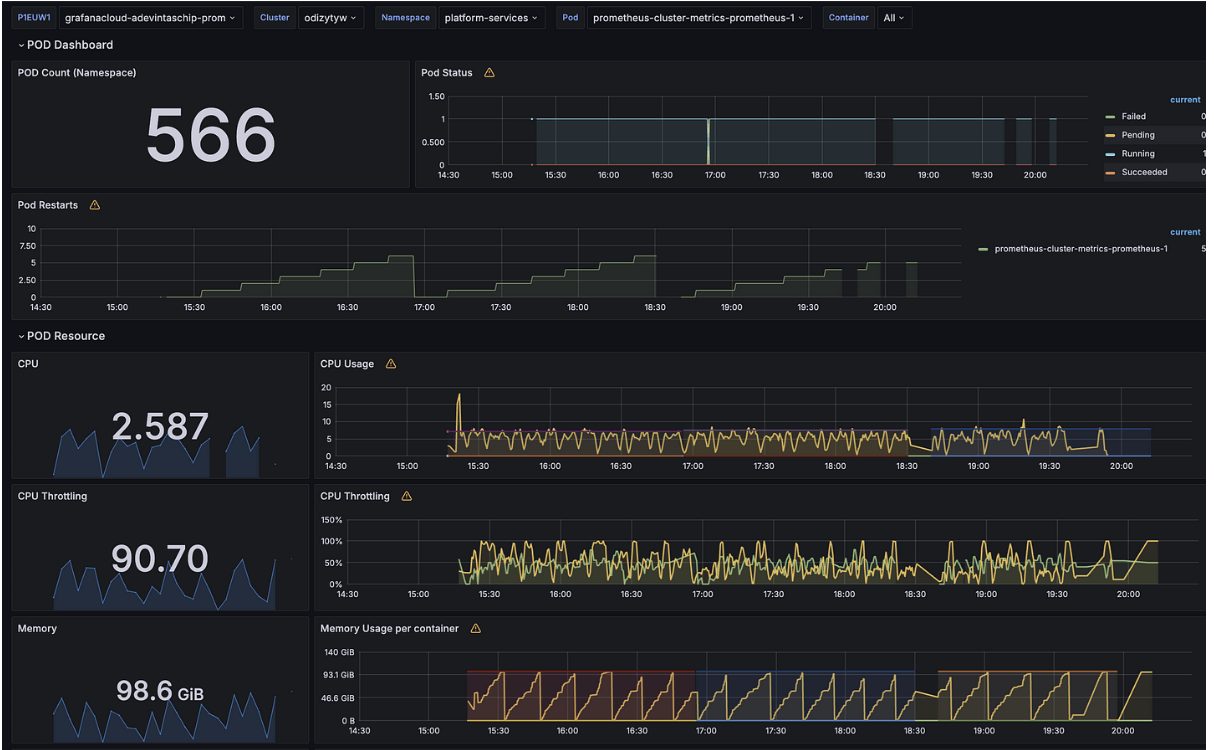
For instance, during periods of rapid metric cardinality spikes such as pod churn, Prometheus’s memory usage could increase abruptly. In such scenarios, the VPA often struggled to scale resources quickly enough to prevent out-of-memory (OOM) events. When Prometheus memory usage spikes rapidly, it risks being ‘OOM killed’ before the VPA can allocate additional resources.
Moreover, our setup involves two Prometheus pods, each receiving all metrics. If VPA begins scaling up one pod, the process of reading data from the EBS volume and reaching a healthy state takes more than ten minutes. If, during this ten-minute window, the memory usage of the second Prometheus pod also reaches its limit, both pods may be OOM killed simultaneously. This dual failure can lead to significant data gaps and disruptions in metric collection.
Prometheus is critical for monitoring and maintaining the health of our infrastructure. Any downtime or data loss can have significant repercussions. By over-provisioning resources, in this case, the memory configured is significantly larger than average as we prioritise reliability and continuity. This ensures that Prometheus can handle unexpected loads and maintain performance without interruption.
The solution
Despite our efforts to manage resource usage effectively, over-provisioning was still a necessary safety net. However, we recently found a promising solution that allowed us to reduce resource consumption significantly.
Our team member found an interesting change in the Prometheus project: https://thenewstack.io/30-pull-requests-later-prometheus-memory-use-is-cut-in-half/
The article explains that in the new Prometheus version, memory footprint is reduced by 50%!
Is it real? Just a version bump?
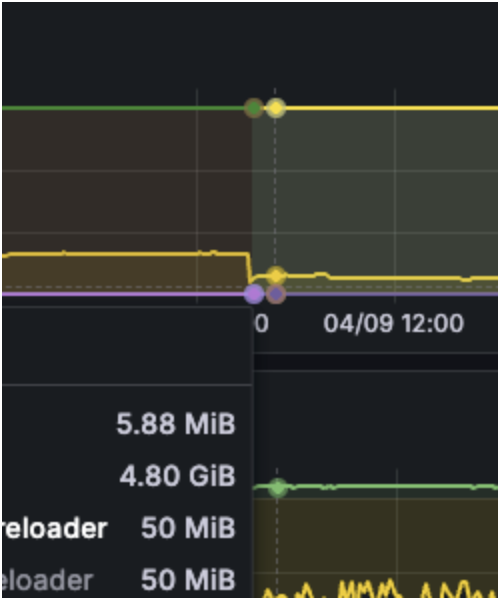
No, this is not just a simple version bump. This update was a game-changer for us. After upgrading to the latest Prometheus version, we observed memory usage reductions in the range of 30% to 50% across our fleets. This improvement is well-documented and aligns with the change explained by the Prometheus community.
Impact
By applying this change, we were able to reduce the requested resources in our VPA configuration significantly. This optimisation allowed us to downsize our over-provisioned resources while maintaining performance and reliability.
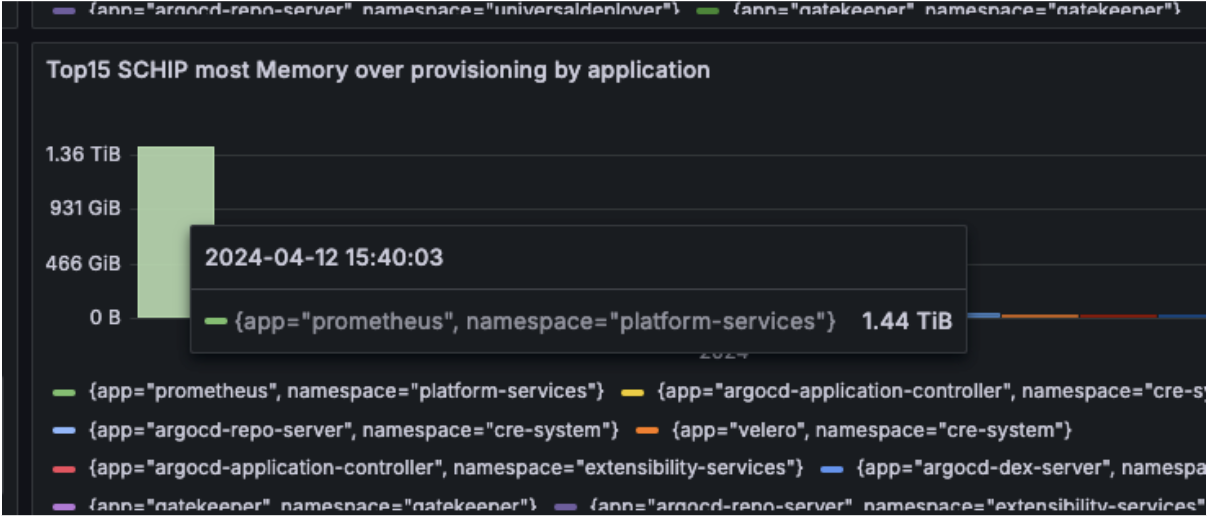
As you can see from the data, we were over-provisioning more than 1.4TB of memory for Prometheus.
After a complete rollout, we reduced the requested memory by more than more than 1TB.
In addition, we have another useful metric that we use to measure our footprint (A ratio between the resources used by the components owned by our team to operate the cluster and our customer workloads).
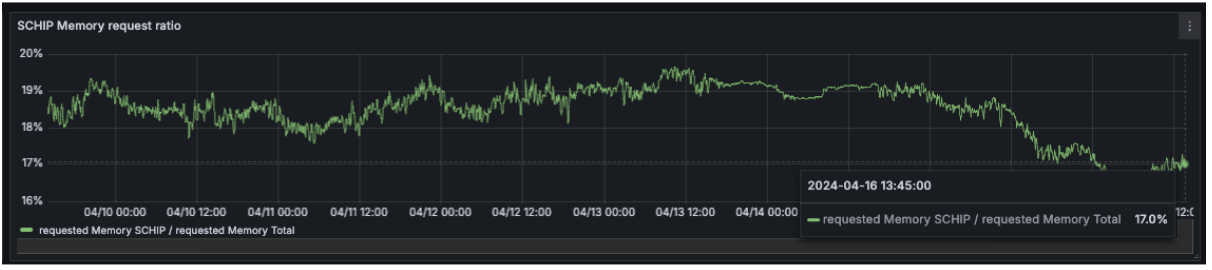
After we completely rolled out this change, we saw a reduction of ~3% in overall memory footprint.
Roll-out process
We were using an EKS-managed NodeGroup for running our Prometheuses and thought we’d have a problem block us from making the change we needed to perform.
A NodeGroup cannot have different instance types (you could specify secondary instance types but they have to be the same size as the main one). Even if we reduced our resources, we would still need to move the pods to different a NodeGroup manually and calculate an instance type that matches the resources after the reduction.
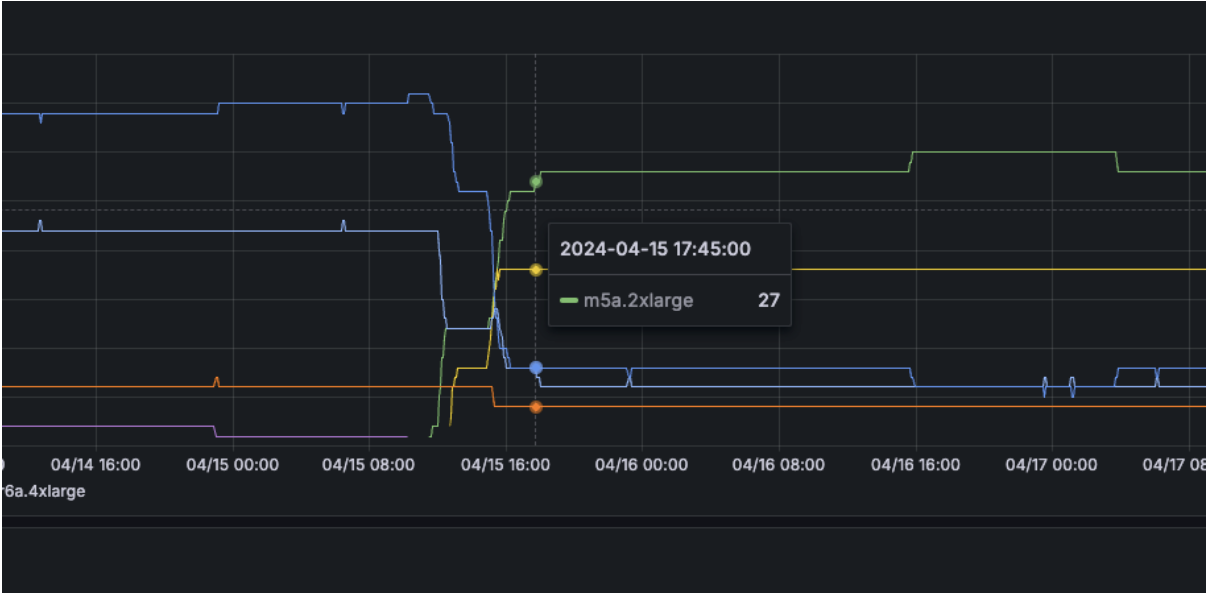
That’s why we decided to move our Prometheus workload to provisioning with Karpenter.
Our Prometheus was first moved to run in Karpenter with the previous over-provisioned configuration. After upgrading the version, these workloads were rescheduled into a new right-sized instance type automatically without our intervention.
Cost savings
The cost savings achieved by reducing 1 TB of memory can vary depending on the type of instance you are using. AWS, for example, provides different types of instances with varying prices. To give you a rough estimate, we can look at the cost of memory for different instance types.
For example, let’s consider the r5 family of instances, the memory-optimised type that we mostly used for Prometheus:
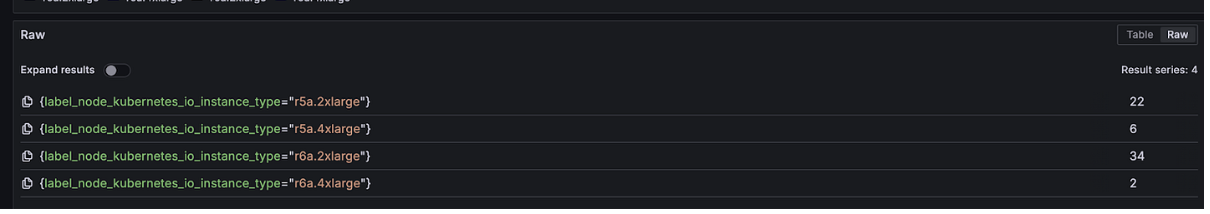
The cost per GB of memory is approximately $0.007875 per hour for the r5 instance family.
Now, to calculate the cost of 1 TB (1024 GB) of memory:
- Cost per hour for 1 TB: 1024 GB * $0.007875 per GB per hour = $8.064 per hour
To calculate the monthly savings (assuming 24/7 usage):
- Monthly savings: $8.064 per hour * 24 hours/day * 30 days/month = $5,814.72 per month
So, reducing 1 TB of memory usage on AWS EC2 in the r5 instance family could save you approximately $5,814.72 per month (note: this is a rough calculation using publicly available pricing)
Next steps
As you might observe, The memory reduction from the new Prometheus version and the more flexible instance types from Karpenter allowed us to be more efficient and work with more right-sized resources. However, the challenge of scaling our metrics infrastructure is still there. Once we scale more, we will still be facing similar issues. So, we will keep investigating and working on making the infrastructure more resilient.
I hope this blog article can give you an insight into our approach to detect cost and hopefully, you can benefit from it. It also highlights the importance of staying up-to-date with the latest software improvements (but of course, new features always come with new bugs 🙏)