
In 2020, Adevinta faced a crucial decision: Should we continue building our experimentation platform or opt for a third-party solution? This dilemma is common for companies of our size and maturity, but it lacks a straightforward answer.
Within our company, diverse opinions, beliefs and perspectives existed, but little alignment on how to proceed. Adevinta consists of local teams and central functions, each with unique viewpoints and needs — as well as commonalities, of course.
To address this, the leadership team mandated the formation of a cross-functional team to make a recommendation.
We assembled a diverse working group comprising analysts, engineers and product managers, each representing their respective organisation and the specific needs of their job family. Our goal was to gain a comprehensive 360° view of the capabilities an experimentation platform needs to have.
Once the working group was established, we moved in two directions. Firstly, we examined our internal situation, creating a snapshot of Adevinta’s current state in experimentation.
We gathered data on available tools, their costs, adoption, use cases and needs, enabling us to provide a comprehensive as-is description.
The second phase involved looking outside our organisation. A significant part of this endeavour involved benchmarking against other companies. We aimed to answer two crucial questions: “How well are we performing in experimentation?” and “What are other companies doing?” While it required effort to research evidence, summarising the process and findings can be quite beneficial.
In this article, I will cover:
- The methodology — how we set the boundaries of our discovery
- The indicator — what data we looked at for our comparison
- The findings — what we have learned looking at the data
With 15 years of hands-on and leadership experience in experimentation, I’ve worked with renowned companies like Zalando, eBay, and eDreams.
Since September 2020, I have been leading Experimentation at Adevinta, overseeing aspects such as tooling, strategy and culture. Now let’s dive into the story.
1. Methodology
We collected information from 21 companies, ensuring that the data sources were reliable. This data came from blog posts, interviews, books or research papers. We intentionally avoided anecdotal information like “my friend at another company said,” therefore, enhancing the transparency and reliability of our findings.
We chose to focus on market leaders from various industries who shared information about their online experimentation programs. This choice was based on our assumption that the size of a business influences its experimentation considerations.
95% of the companies we considered have more than 1,000 employees and the list included well-known players such as Google, IBM, Bing, Airbnb, Booking, Zalando and so on.
These companies share information about their experimentation programs with different levels of detail and might choose to disclose metrics. This became important because we needed to compare them, hence we needed to find a proper indicator.
2. The indicator
We needed a meaningful, specific, straightforward and similar indicator to compare different companies on experimentation.
The obvious one would be the number of experiments a company does, but it definitely lacks context and it doesn’t tell us much.
We settled on the ratio of experiments per full-time employee in technology (FTE). While we acknowledge that this indicator doesn’t tell us much about the quality of a company’s experimentation culture, it serves our purpose.
Additionally, not all companies disclosed the number of tech employees, so we sometimes had to derive this information from available data and industry standards.
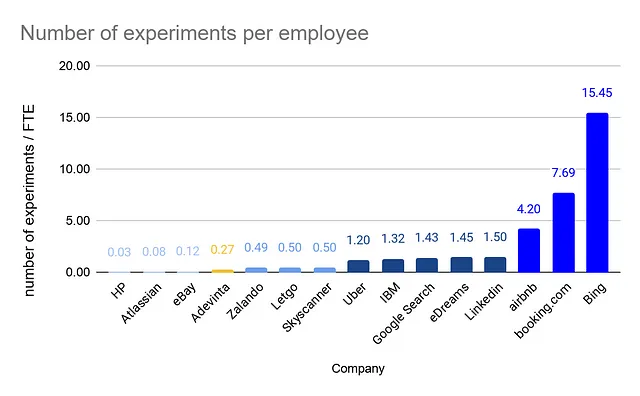
Looking at the graph, we can categorise the data into different groups:
- Anything below 0.2 suggests that experimentation is not well-established or not used at scale, corresponding to a before-crawling phase. We aren’t going to look for role models here.
- Ratios from 0.2 to 1 indicate companies using experimentation but not yet at scale, representing the crawling phase. It’s where we stood when we did the analyses.
- Ratios between 1 and 1.5 belong to companies that extensively rely on experimentation and have integrated it into their way of working, indicating the walking phase. Here we can find insights and examples.
- Companies above 2 have an exceptional ratio of experiments per FTE and are industry outliers, signifying they are flying rather than running. Realistically, this can be the aspiration layer for now.
The sources used to collect this data are available here.
This simple yet effective visualisation helped to bring everyone on the same page: we are not doing well on experimentation, and there is work to be done to improve.
It also implicitly set some targets to track our progress, having a comparison with well-known companies.
I remember being quite excited about this milestone of the project. It took hours of searching to find the data but it was worth it because we finally had good information about tech leaders, with a good representation of different industries, and the result was clear: we can improve our experimentation programme!
3. Findings
To complete our analysis, we collected information on whether the companies in our study use a third-party tool or an internal platform.
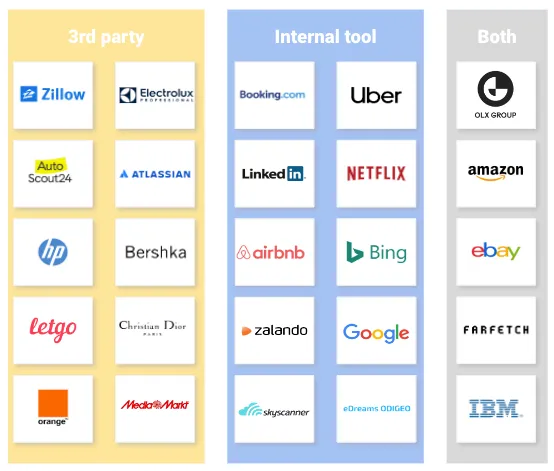
We discovered commonalities among companies using both types of tools, such as managing multiple, different websites acquired over time and dealing with pre-existing tracking systems, architectures and technologies.
Some companies use multiple tools for specific use cases, for example, involving agencies in optimisation projects. Or they are just in a transition phase from one tool to another.
We then overlapped the number of experiments per employee with the type of tool used (third-party versus internal) to draw our key findings.

We noted a correlation between the number of experiments per employee and the use of an internal tool, although we recognise that correlation doesn’t imply causality.
It is however, clear that the companies running huge amounts of experiments rely on internal solutions.
Comparing ourselves to other industry leaders, we realised the need to invest in our experimentation plan to achieve best-in-class status.
While companies like Uber, Google, Airbnb, Booking, Linkedin and Bing run 10,000+ experiments per year, we set intermediate and realistic growth objectives to keep us on track.
Conclusion
This benchmark study, shared in this post, is part of Adevinta’s broader research on experimentation, to inform our strategy and align our expectations. It was a collaborative effort and marked the beginning of our journey.
The working group agreed that the best solution for Adevinta, considering factors such as the volumes of impressions we test on, the company-specific needs and the in-house technology, was to keep building our Experimentation Platform (aka Houston) and to join forces across different markets to foster the experimentation culture.
At the time this article is written, we made enormous gains on our platform, collaboration and culture. This is the result of the work of many passionate people who have contributed since the beginning of this project.
Ultimately, what allowed the working group to align and reach a consensus was our commitment to data-driven decisions and a rigorous approach. We worked with simple and clear indicators that were business-relevant, making it easier to gain buy-in from management.
This work demonstrates that there’s no one-size-fits-all answer to the question: “Should we build or buy our experimentation platform?” The answer depends on numerous factors, both internal and external. A proper assessment is essential to find the right solution for your company.