
By: Wenhe Ye, Software Development Manager at Adevinta
For the acquisition of eBay Classifieds Group, the Global Data Warehouse team at Adevinta migrated 3 PBs of data, plus the 200+ ETL pipelines from eBay on-premise data platform, to Adevinta’s own AWS platform.
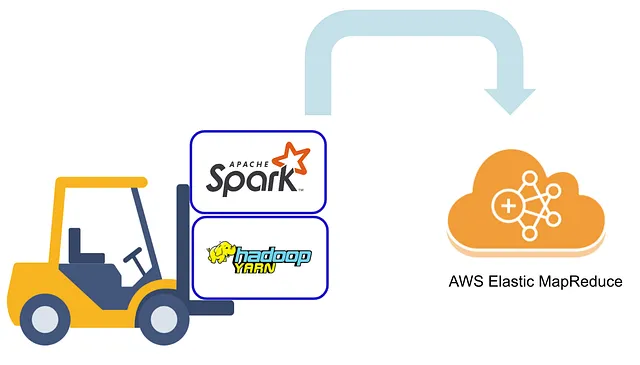
At the core of the eBay on-premise data platform is a Hadoop/Spark cluster, which plays a vital role in data transformation. To minimise the overall code refactoring effort, the team decided to leverage Elastic MapReduce (EMR) as a replacement to the on-premise Hadoop in a so-called “lift-and-shift” strategy.
EMR environment overview
Within Adevinta, our EMR environment is as follows:
- A single EMR on YARN (the “old school” fashion for running Spark applications)
- Spark SQL (in client mode) is what we mostly use for data transformation
- Over 95% of the applications follow the daily batch pattern, which is triggered once per day after the source data become available
- Dynamic allocation and S3 magic committer are enabled
- EMR managed scaling policy is configured to control the number of instances in order to meet the variable resource requests during the day
The issue
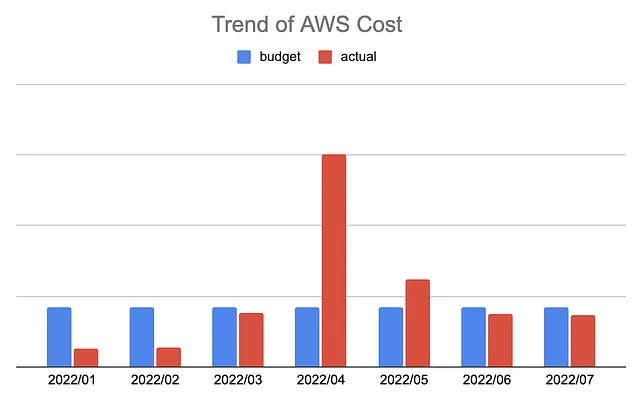
In the first three months of the migration, we set up the infrastructure and used forklift migration for the Spark SQLs and configurations. As there were going to be more jobs being scheduled on the new platform, we needed to increase the resource capacity. Everything worked out as expected without any major hiccups until I received the “bill” showing that the overall monthly cost would skyrocket.
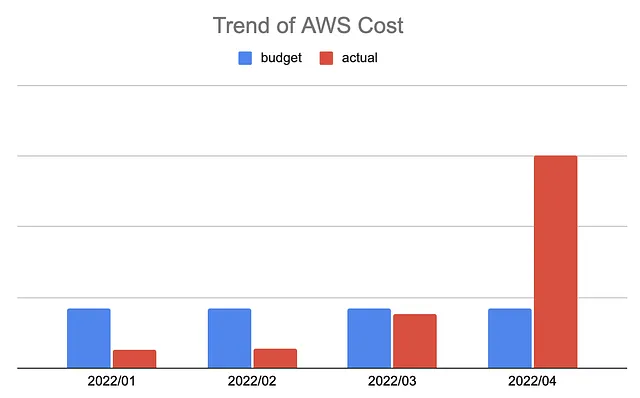
The cost looked astonishing not only in its size, but also in its composition:
Reducing this cost immediately became our top priority. As we were only part-way through the migration, if we let the situation continue, the EMR would keep guzzling the total migration budget. This was definitely not the outcome that we were looking for, so we aimed to find out and fix what was causing this as soon as possible.
Up until this point, most of the EMR features were treated as a black-box. That is, we followed the most generic best practices and leveraged it as a reliable out-of-the-box service for our massive data processing. To tame the beast, we decided to take a deep dive into the issue to understand the root causes.
Visualising the metrics that are most relevant to the cost
First, we needed to collect the data that measures the cost efficiency of the clusters. This was not difficult as our entire team specialises in data engineering and thanks to the DataDog, it became even more straightforward when we imported all of the relevant metrics for visualisation. As we were running an EMR cluster with YARN as the resource manager, we set up a dashboard containing key operational metrics such as the number of nodes running; the submitted vs. accepted applications; allocated vs. unallocated YARN memories, and we also plotted hardware level metrics such as network I/O, disk I/O etc.
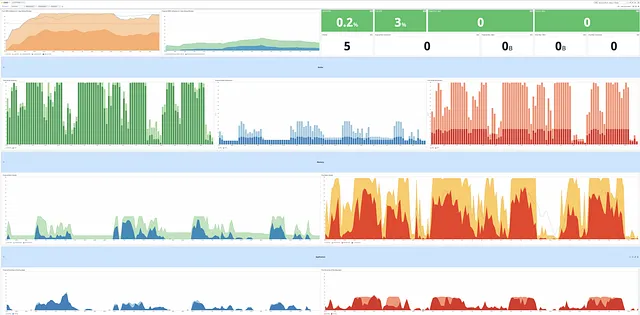
Locking down the key cost contributors
From the dashboard, we identified which factors were contributing the most to the higher-than-expected EMR cost:
- The EMR resource utilisation (allocated/total memory) was low even with the managed scaling policy
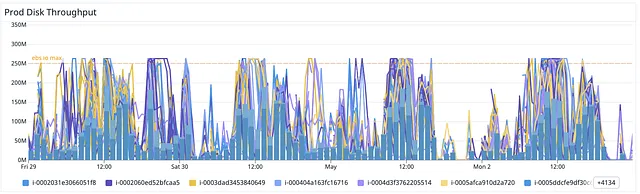
- The EBS disk I/O was capped at the theoretical maximum value at about 250Mb/S
- There were over-provisioned resources in Spark configuration as a result of the “lift and shift” approach.

Action 1: A smarter autoscaling policy
The managed autoscaling policy helps to dynamically provision additional cluster resources to meet a surge demand. However, after some observation and document research, we saw that the managed scaling policy, especially in the context of running Spark applications, does not scale down as smoothly as it scales up. In short, a cluster could be extended to full capacity very easily by only a handful of un-tweaked jobs, but the entire cluster resource could be hung up indefinitely until the shuffling tasks are over. Although this is a great feature for enhanced cluster reliability, it can be problematic when dealing with thousands of jobs written by a group of data engineers with a wide range of experience levels.
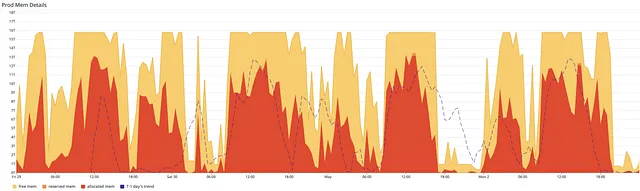
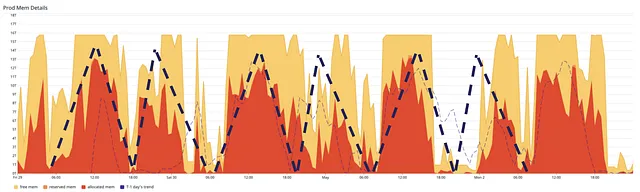
Daily pattern as a result of daily batch processing
As mentioned earlier, 95% of the data processing is carried out on a daily basis. Even though the overall memory consumption distorted the pattern significantly, we could still see that the allocated memory (the red area in the graph below) follows a distinguishable daily pattern with two peaks and two valleys in any 24 hours. The established pattern suggests a way to leash the autoscaling by integrating the prior knowledge, which is unknown to the managed cluster scaler. Because of this, we needed to increase the average cluster utilisation by reducing the ratio of unallocated memory.
AWS Lambda to safeguard the maximum number of nodes
Applying such a hyper parameterised cap based on time brings many challenges. We designed an AWS Lambda function not only to predict, but also to learn the latest cluster usage. The learnt parameters were being kept as a DynamoDB table, so we were able to merge some prior knowledge into the algorithm for a cold start.
The function was set to be triggered as a cron task via the AWS EventBridge. This meant it could frequently supervise the autoscaling policy to not overreact to the poorly configured Spark applications.
Another Lambda watcher to ensure the scaling down
During the practice, we also observed one interesting, but also annoying fact that the scaling-down action could get stuck during the process, which would mean that the cluster would keep running at a higher hourly rate. One way to mitigate this is to interrupt the hanging scaling down process. Therefore, another Lambda function (triggered by the autoscaling events) was set up to watch for any scaling down signals that were at risk of failing. If the scaling down action was not carried out successfully after a certain timeout period, the Lambda watcher would then cancel the action and wait for the next iteration to start over.
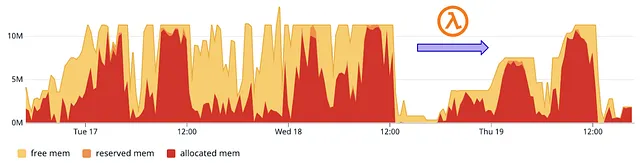
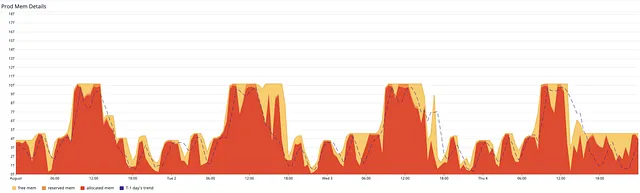
As a result, we saw a significant improvement in the cluster utilisation.
Action 2: Fine tuning the EC2 Instance type
Extended control over the autoscaling policy cut off the visible waste, but how about the hidden waste? Are we using the best instance type for processing hundreds of terabytes of data each day? In this section of the article, we share the trials we did to discover the right selection of EC2 instances.
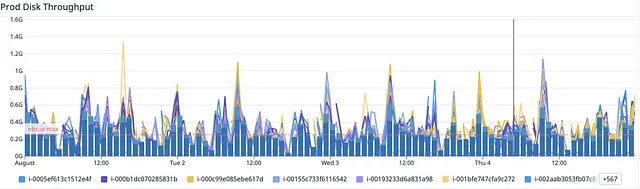
The observation: Spark Shuffling and Disk I/O Caps
One important finding from delving into hardware-level metrics was that we saw a distinct pattern for throttled disk performance on workers. As the worker storage is backed by the EBS, we could see that our observation aligns with the theoretical limits.
The hypothesis: EBS is limiting the performance
Spark applications often involve data shuffling in operators such as Aggregation or Join. If the memory can’t hold all of the data that is going to be distributed to the next stage, disk spill happens. Our ETL jobs contain a large number of such shuffle operations, so we found an opportunity to improve the cost efficiency by switching to a more performant disk type.
The instance store is an offering by the AWS which maximises disk performance. Although it has reduced reliability, it is the perfect solution for storing our data temporarily in our Spark application.
The experiment: Unleash the performance with a Local NVMe Drive
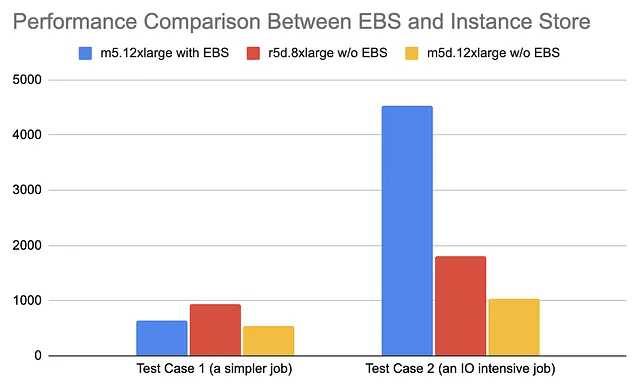
To verify, we designed the tests following a controlled experiment. The original EMR configuration which also served as a baseline for comparison is listed below:
- 1 m5.xlarge for master node
- 12 m5.12xlarge on-demand instances for core and task nodes
- 2 TB EBS (gp2) mounted on each worker
We compared the setting with the testing groups configured as below. The idea was to fix the total memory whilst changing the other variables (size of disks, number of CPUs) as little as possible.
Experiment group A
- 1 m5.xlarge for master node
- 12 m5d.12xlarge on-demand instances for core and task nodes
Experiment group B (another memory optimised EBS backed instance type for reference)
- 1 m5.xlarge for master node
- 9 r5d.8xlarge on-demand instances for core and task nodes
We saw improvement in performance when choosing the EC2 with the instance store for worker storage. We also found that the gap was more distinct when the job involved I/O intensive stages (such as caching and data shuffling).
AWS Graviton: The secret sauce to boost the cost-efficiency
Another recommendation from the AWS solution architect team was to give Graviton instances a try. We ran these tests in parallel to the tests on instance store performance.
Experiment group C
- 1 m5.xlarge for master node
- 18 m6gd.9xlarge on-demand instances for core and task nodes
Experiment group D
- 1 m5.xlarge for master node
- 9 r6gd.8xlarge on-demand instances for core and task nodes
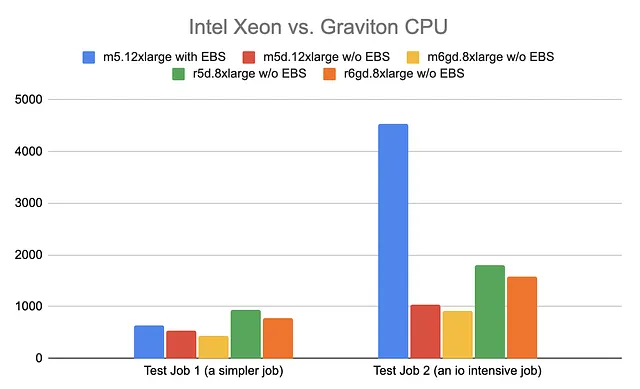
Using the experimental data, we finalised the workers’ instance type to r6gd.8xlarge because compared to the m6gd family, we had a preference for memory supply versus the CPU.
Action 3: Improving the Spark event log delivery
The Spark history server is the user interface for visualising and troubleshooting the slow applications based on the Spark event logs. It works well for a single application, but it’s not easy to use the history server for analysing applications in bulk.
We’ve set up a serverless pipeline for categorising the Spark event logs in near real time.
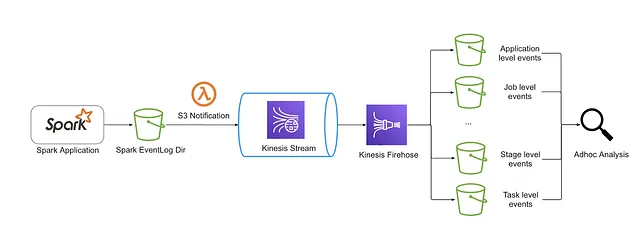
The pipeline automated the log collection in near real time, enabling us to run queries to receive the running profiles of any Spark application. We could then conduct meaningful analysis to see whether there are any Spark applications being sub-optimally configured.

Summary
After the aforementioned practices and review cycles being introduced to the platform, we were pleased to see the entire cost for EMR dropping by more than 60%!
To wrap up, we took actions mainly from three different perspectives to improve the entire resource utilisation with a focus on cost efficiency:
- Heuristic Lambda functions to enforce resource cap for batch clusters
- Graviton EC2 along with the instance store for a maximised cost efficiency
- Kinesis Firehose to delivery the Spark history in a queryable format
We also learnt that cost optimisation requires continuous effort rather than just a one-off investment. Setting a robust cycle of monitoring, planning and delivery is of the utmost importance to keep the optimal status from degrading.